Case study · Live · 2026
Sales Pulse
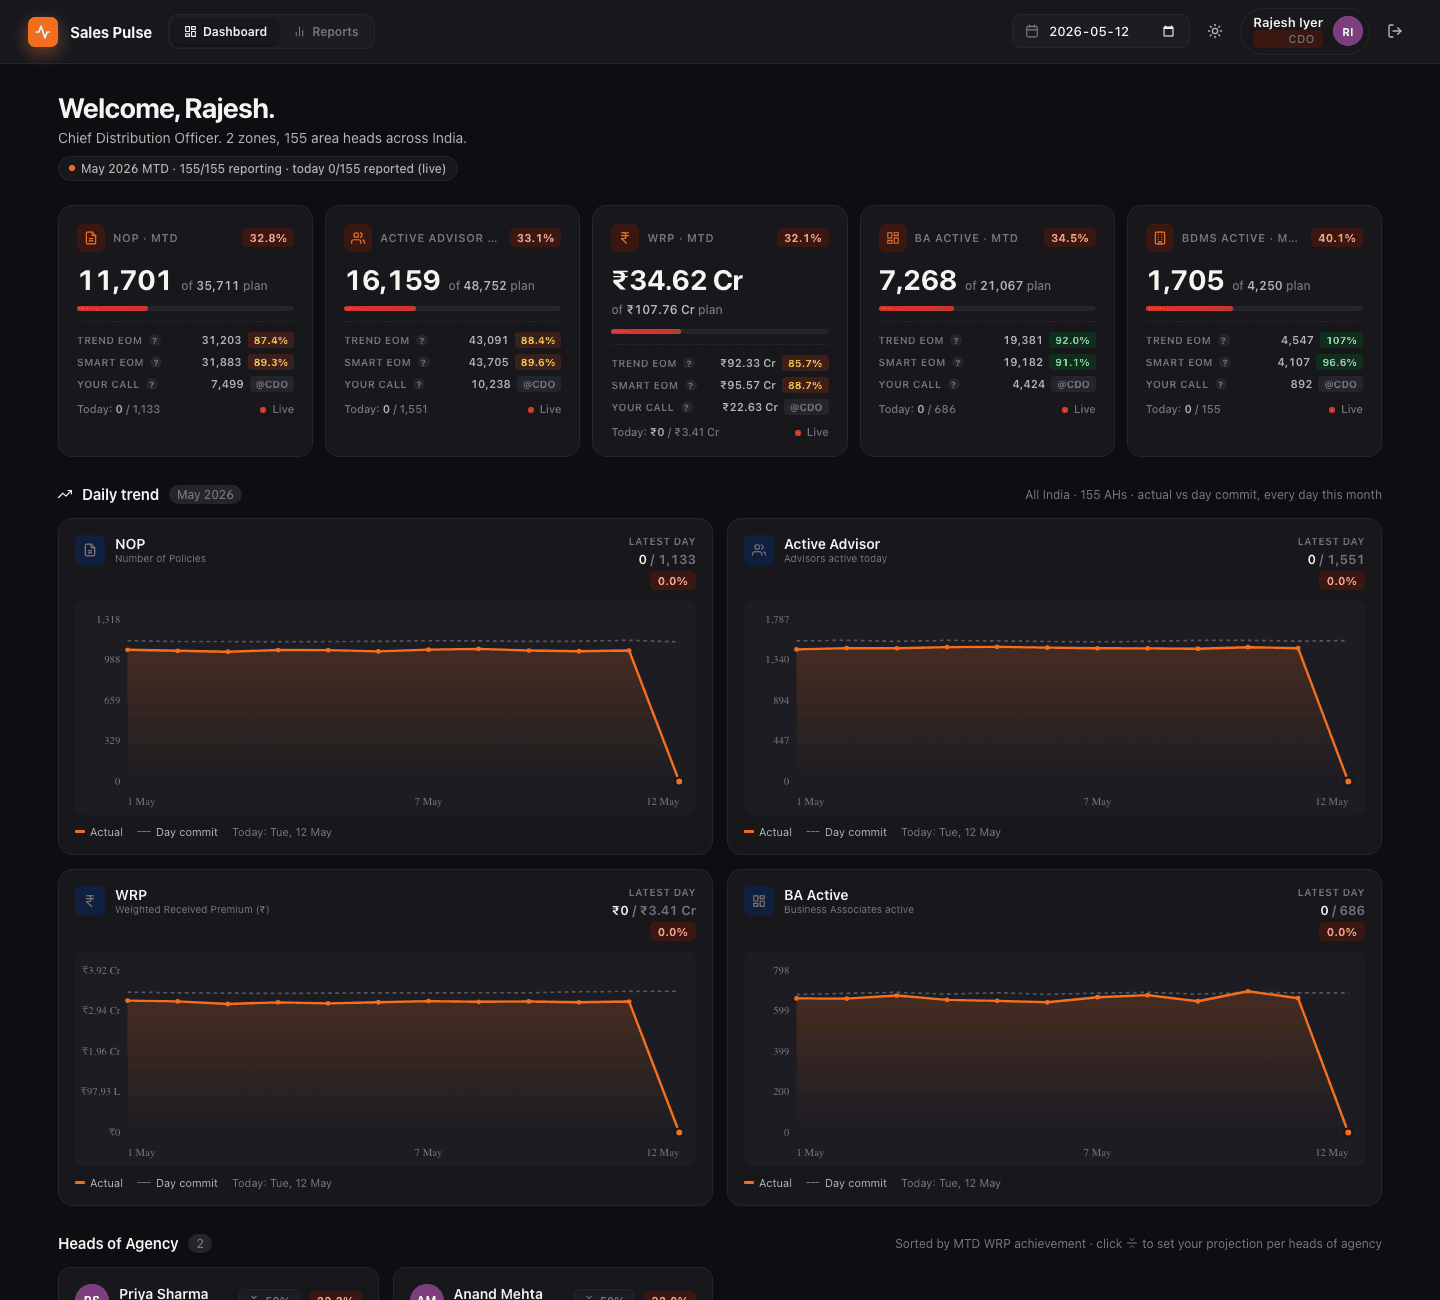
The daily sales dashboard IndiaFirst Life's agency channel runs on. Area heads commit targets each morning and report actuals each evening; the numbers roll up live through every level of the organization.
195 managers
Daily users
4, rolled up live
Org levels
5 sales metrics
Tracked daily
Postgres RLS
Security boundary
01
The problem
Every morning the agency channel rolled its numbers up by hand. Each area head messaged figures to a regional head, who added them up in a spreadsheet and passed them on. It took about ninety minutes, and leadership saw reality a day late. Sales Pulse replaces that with one screen where every level sees the same numbers the moment they are entered.
02
How it works
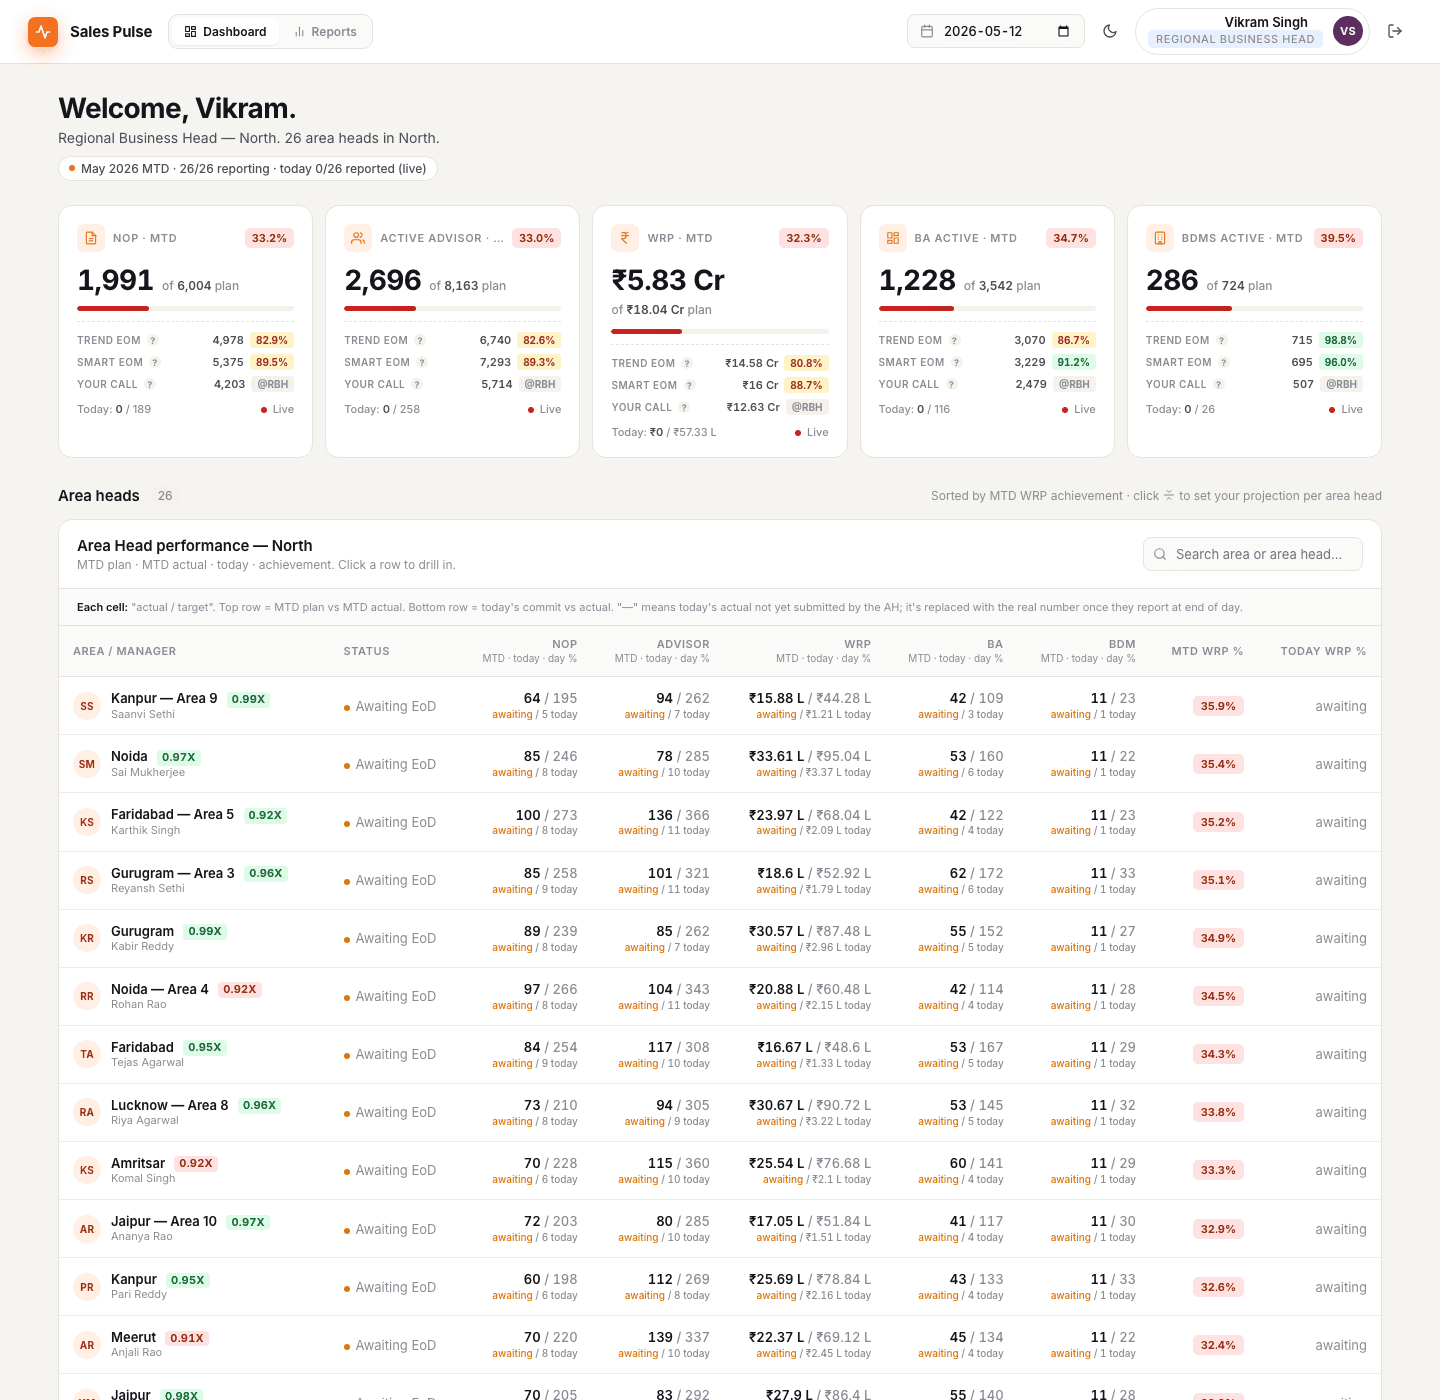
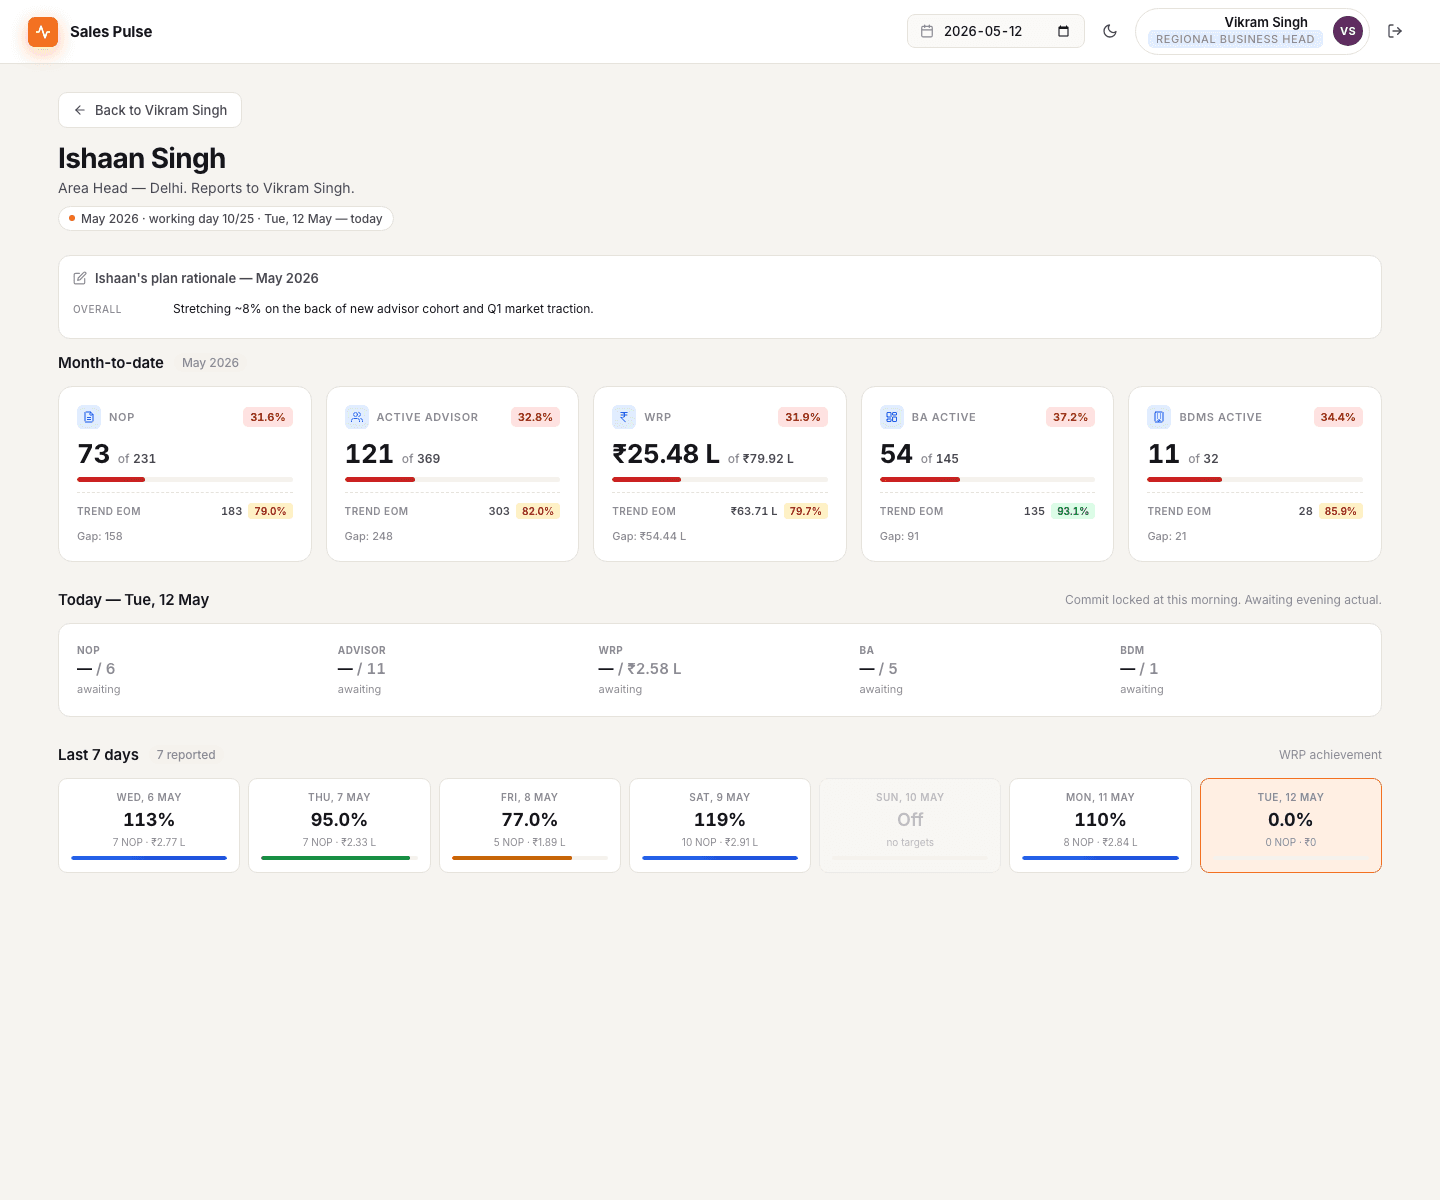
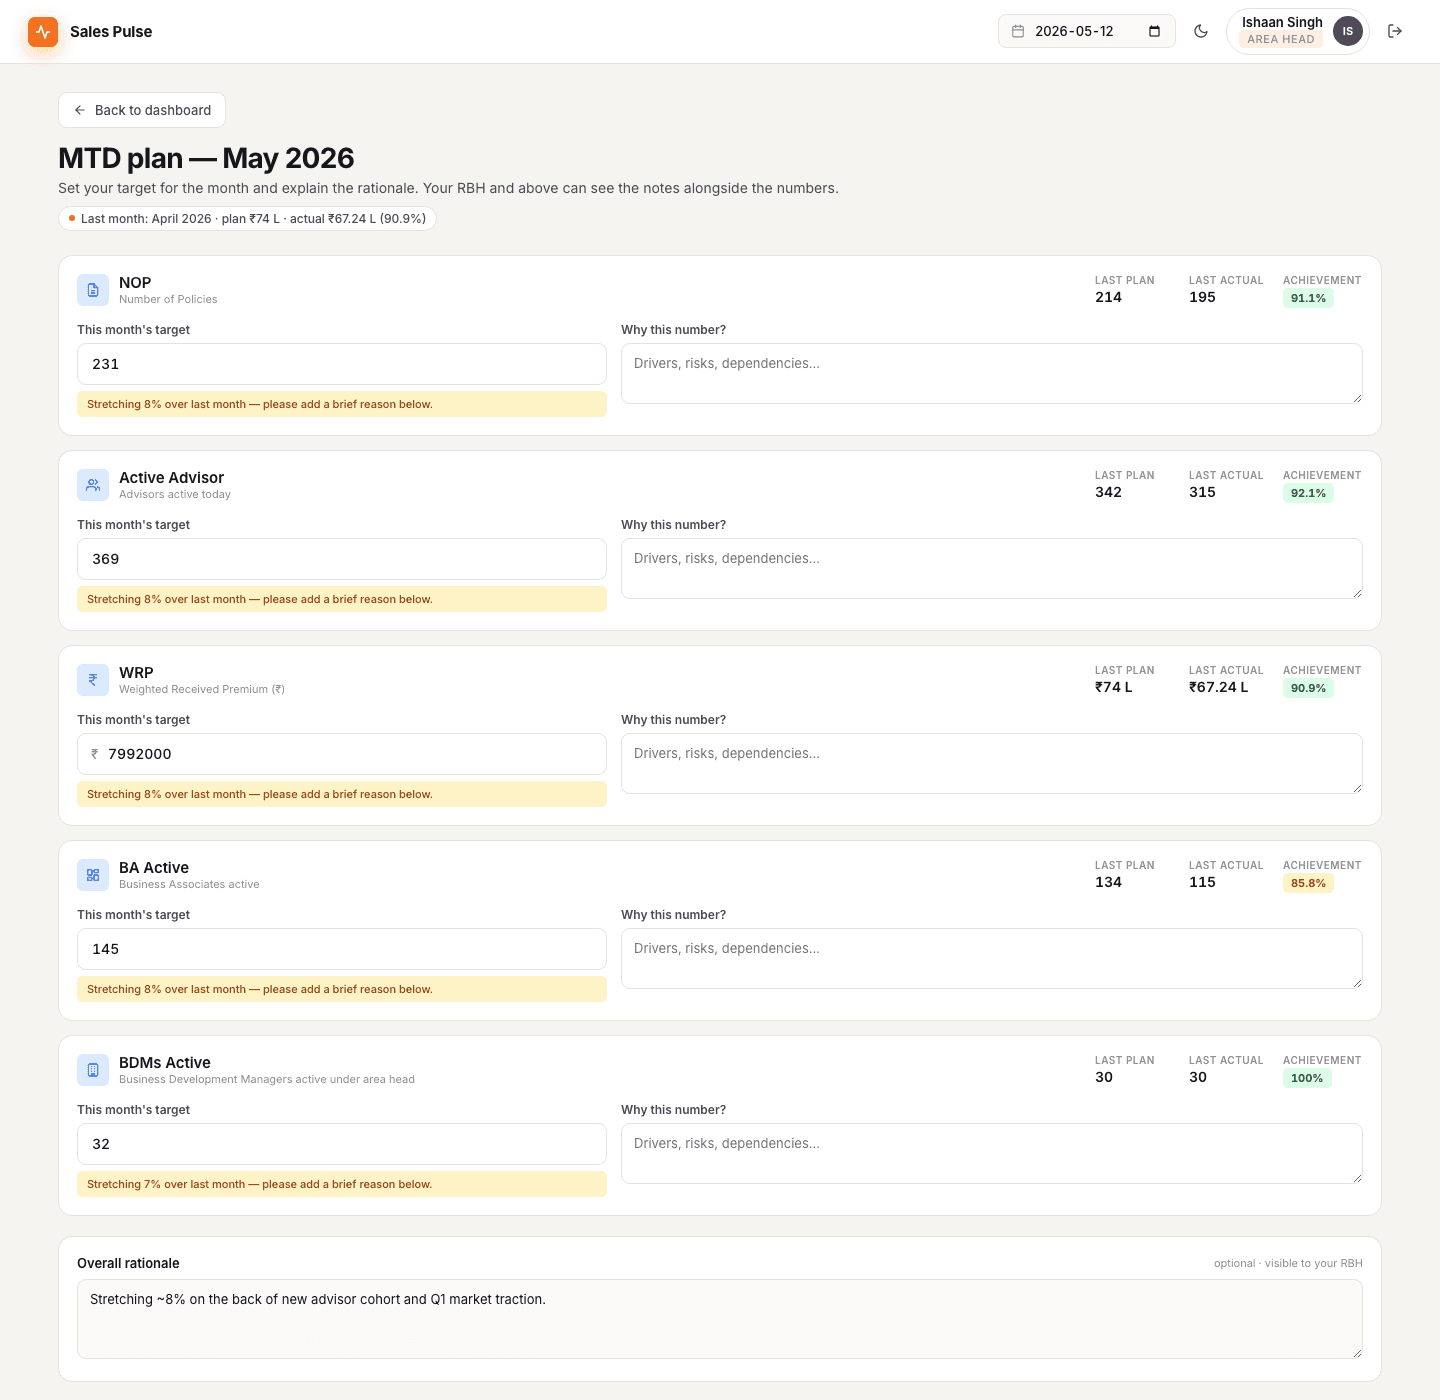
Each area head commits a target for five metrics in the morning. The commitment locks once saved and is blocked after a cutoff, so targets cannot be adjusted after the fact. In the evening they report actuals. Everything aggregates upward through the reporting tree with live achievement percentages, a run-rate projection for month end, and a second projection calibrated on each person's track record. Managers can drill from the national view down to a single area head's last seven days.
03
Architecture
The frontend is a single hand-written page in vanilla JavaScript with no framework and no build step, installable as a PWA so it opens like an app on a phone. The backend is Supabase: Postgres, auth, and realtime subscriptions. Because the public key ships to the browser, row-level security is the entire security boundary. Every table is protected, and visibility is scoped to the reporting tree so a manager can only ever read their own branch.
04
Shipping it for real
It started as a pilot with 29 people and went national. That meant migrating a full roster, working password-reset email through corporate mail filters, an admin panel, Excel exports, and an immutable audit log. Before a feature that let admins define new metrics went live, an adversarial review found eight bugs, including a stored XSS through metric labels. All were fixed before release.
Stack